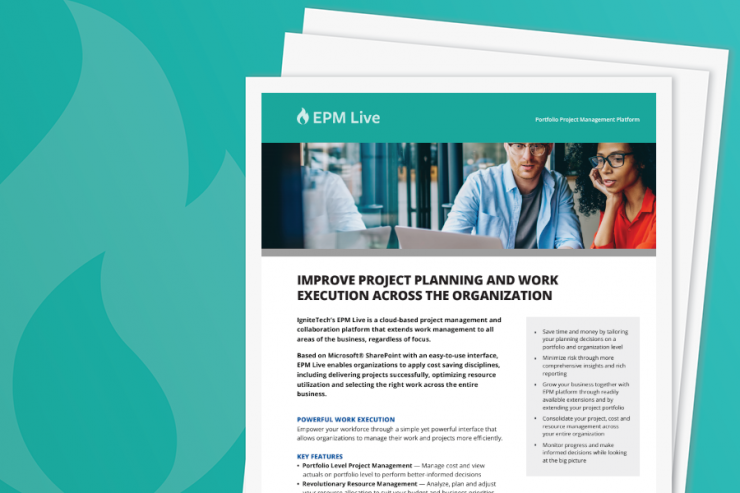
EPM Live is a Microsoft-SharePoint-integrated enterprise portfolio, project and work management solution.
Why EPM Live?
- Expand Microsoft SharePoint capabilities
Provide your organization the ability to manage all projects and work with one solution.
- Leverage what you already own
Keep a familiar Microsoft SharePoint environment to drive adoption.
- Project Management toolset
Track and manage all projects, work and associated costs.
- Extend management control
Enjoy better management visibility into projects, and leverage expanded business intelligence.
NEW GENAI COPILOT FEATURE
EPM Live CoPilot provides GenAI-powered, automated reporting capabilities. Instead of manually digging through reports to analyze project status, resource allocation, or financials, users can now rely on CoPilot to do the heavy lifting for them. After a standard report is run and loaded into the EPM Live Reports section, users can simply click a "Generate Insights" button, and CoPilot will analyze the report to automatically generate a concise textual summary. This summary would highlight key indicators or trends, such as variance in budget vs. actuals, or resource utilization by departments.
BENEFITS
- Time-Saving: Eliminates the need for manual data analysis, saving time for other tasks.
- Actionable Insights: Provides immediate, focused information for better decision-making in project management and financial planning.
COMPLEMENTARY IGNITETECH UNLIMITED SOLUTIONS
Check out the solutions below, available free as part of your EPM Live subscription:
Kayako
Kayako
Deliver exceptional customer service in multiple languages across live chat, email, Facebook and Twitter.
Sococo
Sococo
Sococo is the online workplace where distributed teams come to work together each day, side-by-side.
Blog Posts
Apr 17, 2024
IgniteTech Integrates AI Features Across Its Enterprise Software Portfolio
IgniteTech delivers AI-powered enhancements for 12 of its leading software products, available now…
Apr 11, 2024
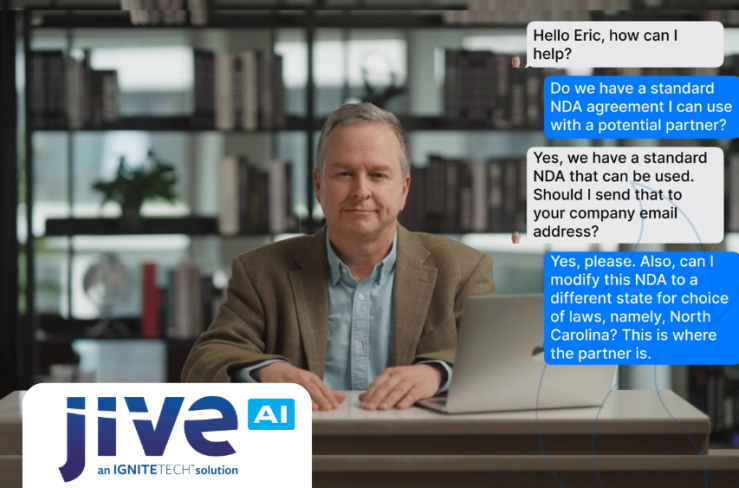
Supercharge Your Team: Expert Knowledge on Demand with Jive Personas
Discover how Jive Personas, an innovative AI-driven solution, transforms the way organizations…

Apr 8, 2024
How computers understand Human Language
Unravel the mysteries of how computers understand human language through the fascinating world of…

Oct 21, 2020
Announcing IgniteTech Insights, our New ML/AI Offering
New capabilities advance mission-critical Expert System processes

Apr 10, 2019
How Unseen Costs Are Hurting Your Business's Bottom Line
To maintain healthy bottom lines, organizations should consider their options for identifying and…

Jan 4, 2019
Why You Need to Switch to Time-Driven Activity-Based Costing Now
If you haven’t already made the switch to a time-driven ABC model, here’s why you shouldn’t wait any…